Aktuelles Infektionsgeschehen
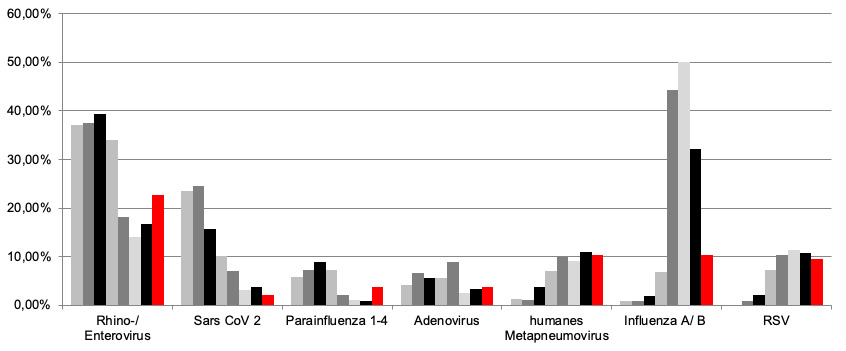
Respiratorische Atemwegserreger (Positivraten) – viral
| Virus | Sept (n=793) | Okt (n=769) | Nov (n=977) | Dez (n=900) | Jan (n=2398) | Feb (n=3758) | Mrz (n=2280) | Apr (n=656) |
| Rhino-/ Enterovirus | 37,20% | 37,55% | 39,32% | 34% | 18,25% | 14% | 16,70% | 22,80% |
| Sars CoV 2 | 23,50% | 24,60% | 15,63% | 10,23% | 7,10% | 3,10% | 3,80% | 2,10% |
| Parainfluenza 1-4 | 5,74% | 7,22% | 8,94% | 7,20% | 2,10% | 1,10% | 0,80% | 3,70% |
| Adenovirus | 4,10% | 6,60% | 5,70% | 5,71% | 9% | 2,60% | 3,30% | 3,70% |
| humanes Metapneumovirus | 1,35% | 1,02% | 3,75% | 7,10% | 10% | 9,10% | 10,90% | 10,40% |
| Influenza A/ B | 0,90% | 0,90% | 1,84% | 6,80% | 44,30% | 50,10% | 32,20% | 10,40% |
| RSV | 0% | 0,95% | 2,22% | 7,23% | 10,40% | 11,30% | 10,80% | 9,60% |

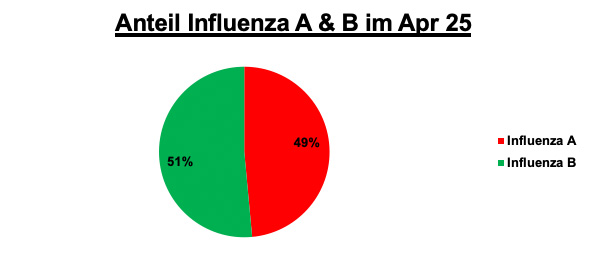
Anteil Influenza A & B im April 2025
| Influenza A | 33 |
| Influenza B | 35 |

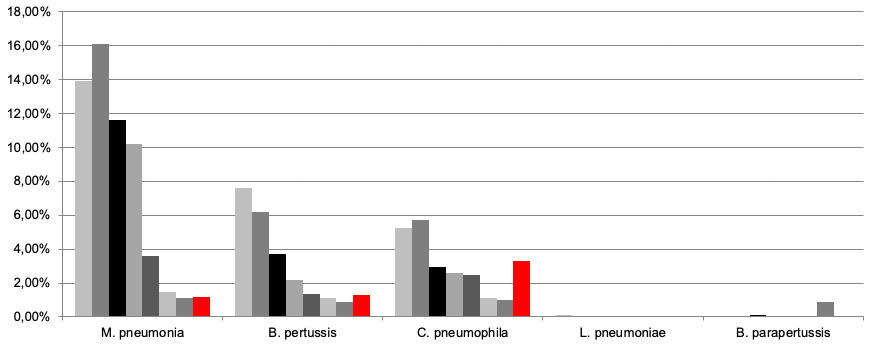
Respiratorische Atemwegserreger – bakteriell
| Bakterium | Sept (n=942) | Okt (n=855) | Nov (n=1078) | Dez (n=961) | Jan (n=1706) | Feb (n=2014) | Mrz (n=1430) | Apr (n=493) |
| M. pneumonia | 13,90% | 16,10% | 11,60% | 10,20% | 3,60% | 1,50% | 1,10% | 1,20% |
| B. pertussis | 7,60% | 6,20% | 3,70% | 2,18% | 1,34% | 1,10% | 0,90% | 1,30% |
| C. pneumophila | 5,24% | 5,70% | 2,95% | 2,62% | 2,46% | 1,10% | 1% | 3,30% |
| L. pneumoniae | 0,14% | 0% | 0% | 0% | 0% | 0% | 0% | 0% |
| B. parapertussis | 0% | 0% | 0,10% | 0% | 0% | 0% | 0,90% | 0% |

